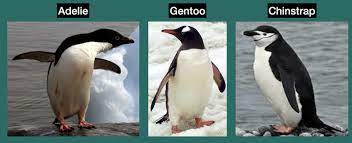
First we need to load the penguin data set, just like last week. The dataset will be called penguins This data was collected by real scientists! Data were collected and made available by Dr. Kristen Gorman and the Palmer Station, Antarctica LTER, a member of the Long Term Ecological Research Network.
library(palmerpenguins)penguins
# A tibble: 344 × 8
   species island    bill_length_mm bill_depth_mm flipper_length_mm body_mass_g
   <fct>   <fct>              <dbl>         <dbl>             <int>       <int>
 1 Adelie  Torgersen           39.1          18.7               181        3750
 2 Adelie  Torgersen           39.5          17.4               186        3800
 3 Adelie  Torgersen           40.3          18                 195        3250
 4 Adelie  Torgersen           NA            NA                  NA          NA
 5 Adelie  Torgersen           36.7          19.3               193        3450
 6 Adelie  Torgersen           39.3          20.6               190        3650
 7 Adelie  Torgersen           38.9          17.8               181        3625
 8 Adelie  Torgersen           39.2          19.6               195        4675
 9 Adelie  Torgersen           34.1          18.1               193        3475
10 Adelie  Torgersen           42            20.2               190        4250
# ℹ 334 more rows
# ℹ 2 more variables: sex <fct>, year <int>
library(tidyverse) # to make tidyverse commands available
── Attaching core tidyverse packages ──────────────────────── tidyverse 2.0.0 ──
✔ dplyr     1.1.4     ✔ readr     2.1.5
✔ forcats   1.0.0     ✔ stringr   1.5.1
✔ ggplot2   3.5.1     ✔ tibble    3.2.1
✔ lubridate 1.9.3     ✔ tidyr     1.3.1
✔ purrr     1.0.2
── Conflicts ────────────────────────────────────────── tidyverse_conflicts() ──
✖ dplyr::filter() masks stats::filter()
✖ dplyr::lag()    masks stats::lag()
ℹ Use the conflicted package (<http://conflicted.r-lib.org/>) to force all conflicts to become errors
Create a vector that is the subset of the data with only penguins that live on Torgersen. How many penguins is this?
penguins <-na.omit(penguins)torg <-filter(penguins, island =="Torgersen")torg
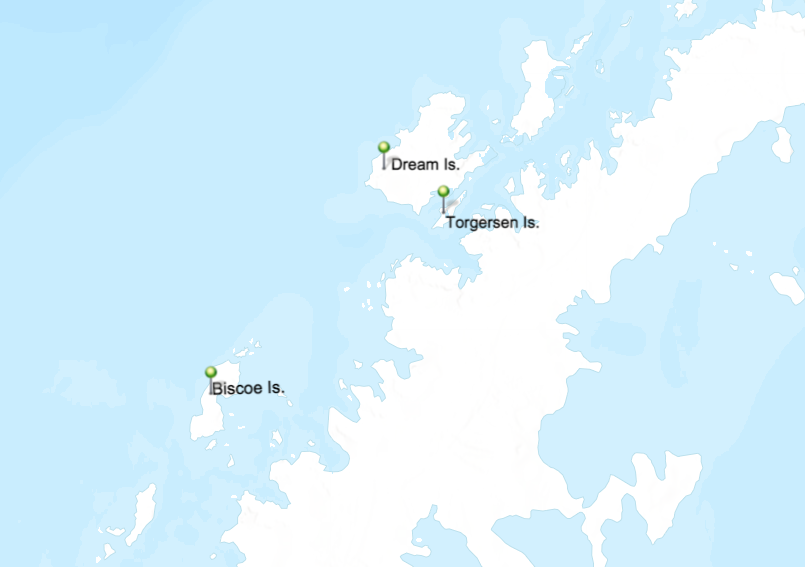
The penguins live on different islands. The islands are different sizes and located in different locations within the Palmer Archipelago. This could affect the avaibility of prey, habitat, etc.
6. Do the Adelie penguins living on Torgersen Island have a different mean body mass than the Adelie penguins living on Biscoe?
# one way is using filters and later calulating mass# first create vectors that are 1. only Adelie on Torgersen and 2. only Adelie on BiscoeadelieTorgersen <-filter(penguins, island=="Torgersen"& species=="Adelie")adelieTorgersen
# another way is using group by with multiple criteria, search through the table to find the rows that show Adelies on Torgersen and BiscoemassByIslandSpecies <- penguins %>%group_by(island, species) %>%summarize(avgMass=mean(body_mass_g), sdMass=sd(body_mass_g))
`summarise()` has grouped output by 'island'. You can override using the
`.groups` argument.
Do the female Adelie penguins living on Torgersen Island have a different mean body mass than the female Adelie penguins living on Biscoe? Calculate both the mean and standard deviation of body mass for both groups.
# one way is using filters and later calulating mass# first create vectors that are 1. only Adelie on Torgersen and 2. only Adelie on BiscoeadelieTorgersenF <-filter(penguins, island=="Torgersen"& species=="Adelie"& sex=="female")adelieTorgersenF
# then caclulate the average mass of each of those subsetsadelieTorgersenMassF <-mean(adelieTorgersenF$body_mass_g)adelieTorgersenSdF<-sd(adelieTorgersenF$body_mass_g)adelieTorgersenMassF
Warning: Returning more (or less) than 1 row per `summarise()` group was deprecated in
dplyr 1.1.0.
ℹ Please use `reframe()` instead.
ℹ When switching from `summarise()` to `reframe()`, remember that `reframe()`
  always returns an ungrouped data frame and adjust accordingly.
`summarise()` has grouped output by 'species'. You can override using the
`.groups` argument.
speciesByIsland
# A tibble: 5 × 2
# Groups:   species [3]
  species   penguinSp
  <fct>     <fct>
1 Adelie    Torgersen
2 Adelie    Biscoe
3 Adelie    Dream
4 Chinstrap Dream
5 Gentoo    Biscoe
# on Torgersen# Adelie only # on Biscoe# Adelie and Gentoo# on Dream#Adelie and Chinstrap