Q1. (2 points) Describe null and alternative hypotheses for:
The difference in means of seal count in Wilhelmenia vs. Marguarite bay
the difference in means of fish count in Wilhelmenia vs. Marguarite bay
Q2. (2 points) Generate helpful visualizations and descriptive statistics for the above data
Q3. (4 points) Perform t-tests to evaluate your hypotheses, and interpret the results. Reject the null hypothesis if p<0.05.
Answers
Q1.
\(H_{0}\): There is no difference in the mean seal count in Wilhelmia and Marguarite bay. There is no difference in the mean fish count in Wilhelmia and Marguarite bay.
\(H_{a}\):There is a difference in the mean seal count in Wilhelmia and Marguarite bay. There is a difference in the mean fish count in Wilhelmia and Marguarite bay.
Q2.
library("tidyverse")
── Attaching core tidyverse packages ──────────────────────── tidyverse 2.0.0 ──
✔ dplyr     1.1.4     ✔ readr     2.1.5
✔ forcats   1.0.0     ✔ stringr   1.5.1
✔ ggplot2   3.5.1     ✔ tibble    3.2.1
✔ lubridate 1.9.3     ✔ tidyr     1.3.1
✔ purrr     1.0.2
── Conflicts ────────────────────────────────────────── tidyverse_conflicts() ──
✖ dplyr::filter() masks stats::filter()
✖ dplyr::lag()    masks stats::lag()
ℹ Use the conflicted package (<http://conflicted.r-lib.org/>) to force all conflicts to become errors
seals <-read_csv("arctic-seals.csv")
Rows: 640 Columns: 5
── Column specification ────────────────────────────────────────────────────────
Delimiter: ","
chr  (2): time, bay
dbl  (2): area, num_seals
date (1): date

ℹ Use `spec()` to retrieve the full column specification for this data.
ℹ Specify the column types or set `show_col_types = FALSE` to quiet this message.
fish <-read_csv("arctic-fish.csv")
Rows: 640 Columns: 5
── Column specification ────────────────────────────────────────────────────────
Delimiter: ","
chr  (2): time, bay
dbl  (2): net, num_fish
date (1): date

ℹ Use `spec()` to retrieve the full column specification for this data.
ℹ Specify the column types or set `show_col_types = FALSE` to quiet this message.
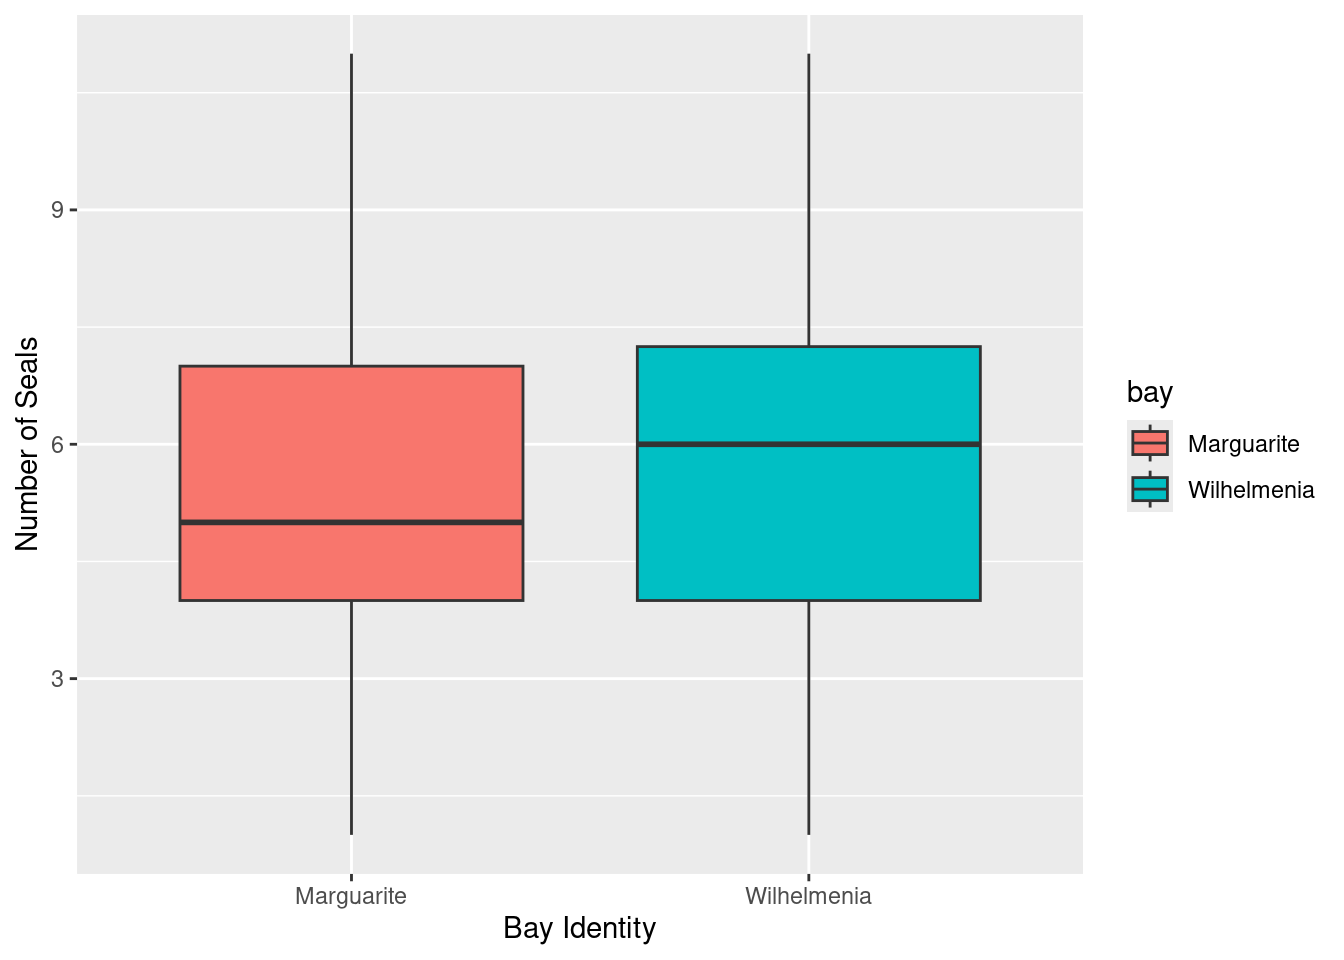
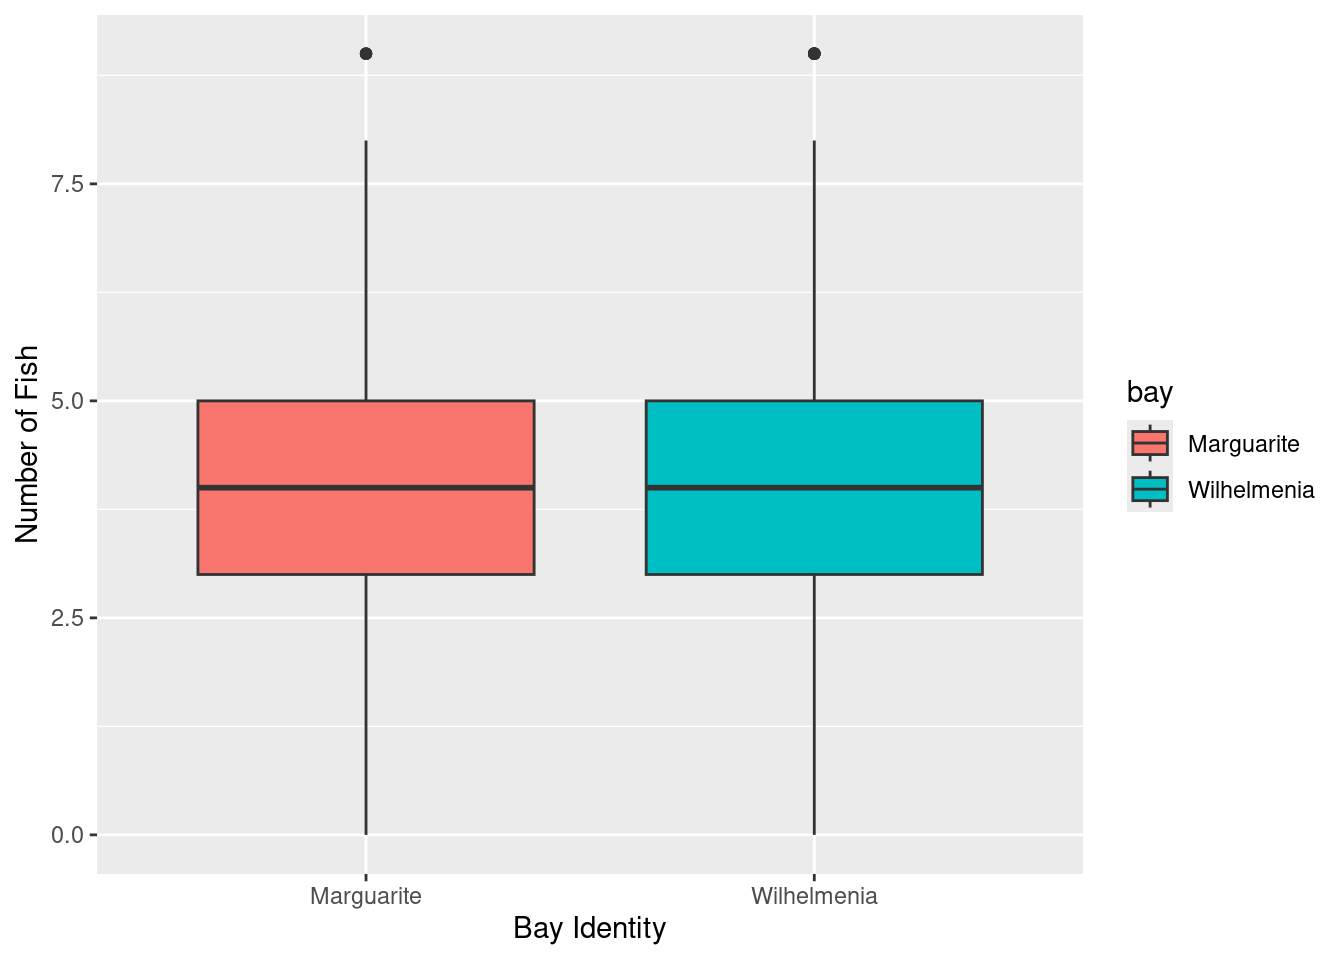
# descriptive statssummarySeals <- seals %>%group_by(bay) %>%summarize(mean(num_seals), sd(num_seals))summaryFish <- fish %>%group_by(bay) %>%summarize(mean(num_fish), sd(num_fish))# data visualization: best to do a boxplot or bar chartsealsPlot <- seals %>%ggplot(aes(bay, num_seals, fill= bay)) +geom_boxplot() +xlab("Bay Identity") +ylab("Number of Seals")fishPlot <- fish %>%ggplot(aes(bay, num_fish, fill = bay)) +geom_boxplot() +xlab("Bay Identity") +ylab("Number of Fish")summarySeals
# A tibble: 2 × 3
  bay         `mean(num_seals)` `sd(num_seals)`
  <chr>                   <dbl>           <dbl>
1 Marguarite               5.25            2.10
2 Wilhelmenia              5.95            2.10
summaryFish
# A tibble: 2 × 3
  bay         `mean(num_fish)` `sd(num_fish)`
  <chr>                  <dbl>          <dbl>
1 Marguarite              3.91           1.76
2 Wilhelmenia             4.16           1.96
sealsPlot
fishPlot
Q3.
# t test for sealssealsT <-t.test(data = seals, num_seals ~ bay)sealsT
    Welch Two Sample t-test

data:  num_seals by bay
t = -4.2182, df = 638, p-value = 2.82e-05
alternative hypothesis: true difference in means between group Marguarite and group Wilhelmenia is not equal to 0
95 percent confidence interval:
 -1.0258729 -0.3741271
sample estimates:
 mean in group Marguarite mean in group Wilhelmenia
                     5.25                      5.95
# Interpretation: The p-value is 0.0000272, which is less than our alpha level of 0.05, so we can reject the null. # We conclude that the mean number of seals is different between Marguarite and Wilhelmia Bay# t test for fishfishT <-t.test(data = fish, num_fish ~ bay)fishT
    Welch Two Sample t-test

data:  num_fish by bay
t = -1.7366, df = 630.63, p-value = 0.08295
alternative hypothesis: true difference in means between group Marguarite and group Wilhelmenia is not equal to 0
95 percent confidence interval:
 -0.54602183  0.03352183
sample estimates:
 mean in group Marguarite mean in group Wilhelmenia
                  3.90625                   4.16250
# Interpretation: The p-value was 0.08, which is greater than our alpha level of 0.05, so we cannot reject the null.# We conclude that the mean number of fish is not different between Marguarite and Wilhelmia Bay.