Biodiversity Lesson
Grade Level & Class type
- Appropriate for: 9th-12th grade
- Subject: Intro Biology, Honors Biology, IB Biology
- Number of students: 30 per class
- Time: Single 90 minute lesson (also included are resources for a longer unit)
Lesson Plan and Tutorial

Lesson Overview
Lesson Title: Biodiversity
Lesson Description:


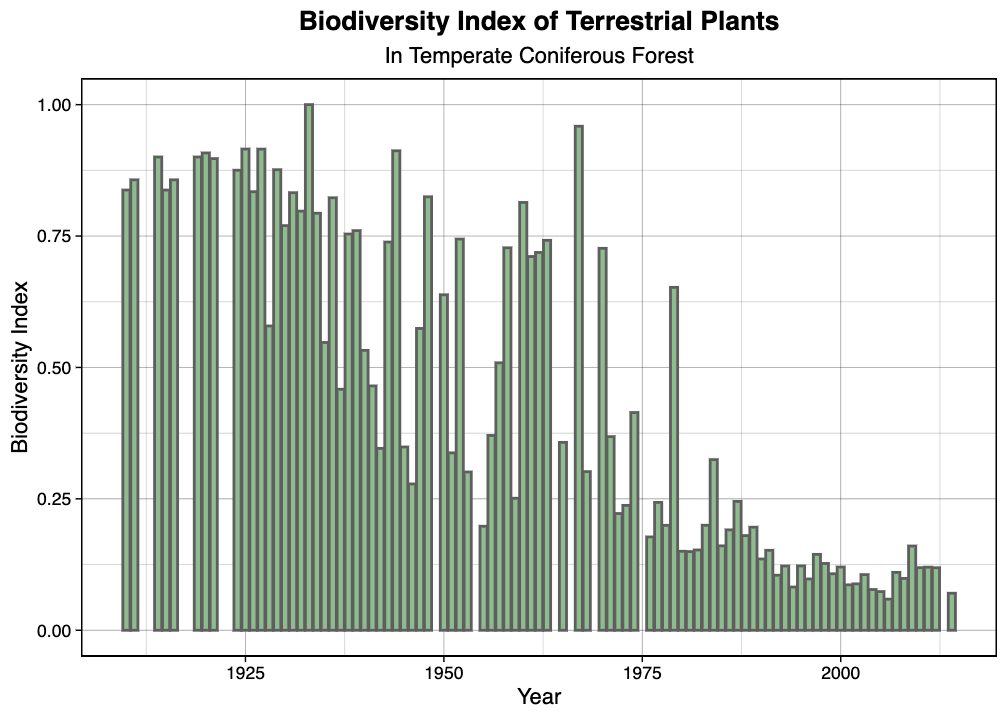
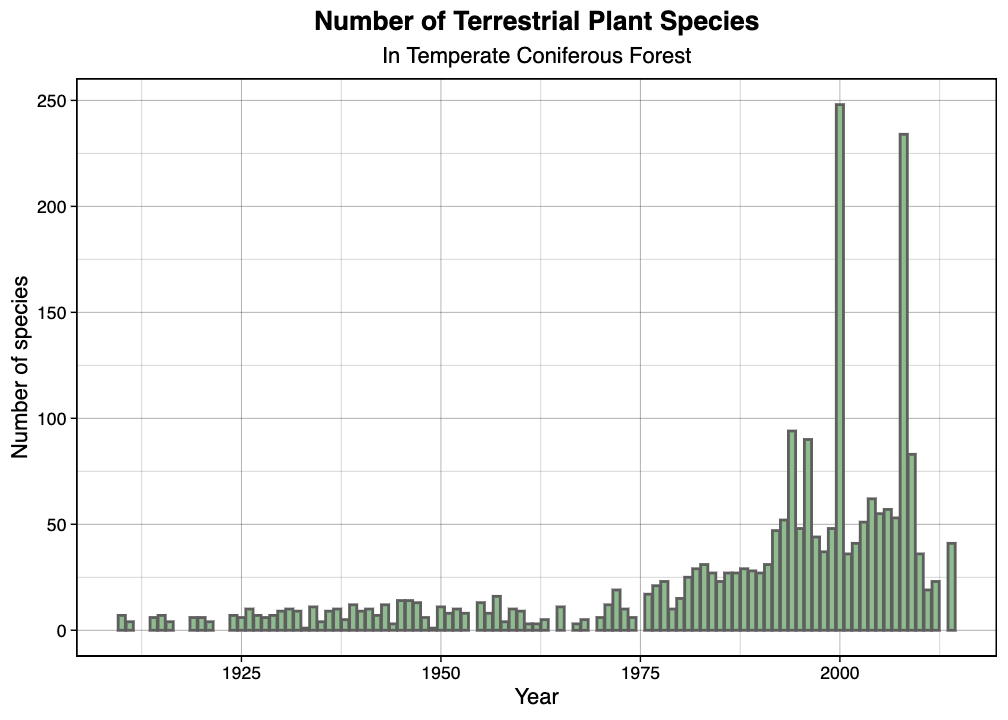
Long Term Ecological Research sites (LTERs). Students will look at long term biodiversity trends in groups. See example graphs at left. Students will be able to create the following graphs to analyze biodiversity:
- Temperate Coniferous Plant OR Invertebrates Total Species
- Temperate Coniferous Plant OR Invertebrates Diversity Index
- Tropical Plant OR Invertebrates Total Species
- Tropical Plant OR Invertebrates Diversity Index
THESE GRAPHS STILL IN PROGRESS:
- Temperate Deciduous Plant OR Invertebrates Total Species
- Temperate Deciduous Plant OR Invertebrates Diversity Index
- “All Ecosystem” Plant Total Species
- “All Ecosystem” Plant Diversity Index
Data Science in the Lesson
An undergraduate student came into the classroom and helped teach the lesson. She introduced herself as a data science minor at Lewis and Clark and then went into what data science is. She talked about her experience with it through the classes she took and how she used data science so far in college. Students were able to run some code to look at graphs. We discussed trends after.
- Note: this lesson was originally taught with the assistance of undergraduate students who demonstrated coding. If you have not coded before and would like to incorporate basic data science/coding into your lesson, refer to the online biodiversity tutorial for an easy walk-through you can use to demonstrate data science in your classroom!
Broader Unit Context
This data science/coding lesson was integrated within a larger Biodiversity Unit - see materials for that unit below. The students had already studied the meaning, levels, and status of biodiversity globally as well as ways that biodiversity is measured and conserved. We had implemented a series of data collection/field survey activities including recording data about the presence/absence of various types of tree species on our campus. This effort was then connected back to the BIOTIME dataset and the coding analysis.
Lesson Materials
-
- Introduction to ecology field research, collecting and analyzing data.
-
- Description: This is the website that hosts the BIOTIME data used to create the graphs in this lesson. We evaluated the website together with the students the days before the data science lesson.
Biodiversity Interactive Coding Tutorial
- Description: Online tutorial which provides a walk-through on how to deal with large amounts of data and create custom biodiversity graphs.
-
- Template where students can paste the graph they created using the online website. They are asked to create a title and caption for the graph.
Biodiversity Large Scale Graphic Organizer
- Graphic organizer for students to demonstrate what they’ve learned in this lesson so far about biodiversity. Includes an overview of biodiversity, ecological research programs, and comparing graphs they created.
Optional: Biodiversity Lesson Code .zip file
- Description: .zip file of the R code used to create the graphs used in this lesson. Can be uploaded into posit.cloud or Rstudio desktop and run from there, if you are familiar with coding.
Broader Unit Materials
This lesson was taught by two different teachers and incorporated into slightly different broader units. We’ve included both teachers materials below, separated into each of their units.
Biodiversity Unit - IB Biology
- Biodiversity and Ecology Unit Plan
- Description: Unit plan used in an IB Biology classroom. Includes many links to resources, slides, assessments, worksheets, and more!
Biodiversity Unit - HIPPO framework
- Slides: Biodiversity: Status, Value, and Threats
- Description: This is the slideshow I used to introduce the topic to the students. I presented these slides and the students took notes over several class periods. I designed the lecture around the HIPPO framework for Biodiversity loss that is detailed in the HHMI Biointeractive site I linked to below.
- HHMI:Biointeractive
- Description: HHMI Biointeractive is one of the leading on-line resources for teaching biology at the high school level. I have found their materials to be extremely useful and interactive and they always generate a high level of student engagement.
- Tree Surveys: 1, 2, 3, 4,
- Description: As part of the Biodiversity Unit, I have my students collect data about different plants/trees on the campus including species name, size, height, crown spread, etc. We conduct multiple surveys so the students can see temporal changes to the plants/trees over time. I presented this work as kind of the front end/first step of the process of data analysis that ends with large scale analysis of trends that can be done with Coding.
- BIOTIME website
- Description: This is the website that hosts the BIOTIME data. We evaluated the website together with the students the days before the data science lesson.
Reflection from teachers who have taught this lesson before
What worked well? Why?
- The data science lesson was well timed and integrated with our biology curriculum, specifically the unit on biodiversity. Students were already familiar with the key concepts around biodiversity and had already experienced collecting their own biodiversity data so they were well primed to talk about these larger datasets and analysis.
What do you feel was missing?
We implemented this lesson in a single, 50 minute class period. The actual student work time was probably 30-35 min. This is a huge topic to teach in a single, short period. It would have been better to have several points of engagement and scaffolding for the students that unfolded over multiple days.
Data science is a broad field that includes data collection, data management, data visualization (maps, graphs, etc), data analysis, communicating data, etc. Each of these types generate different levels of student learning and engagement. It would have been interesting to actually assess which data science approach garnered the most student engagement and learning. Perhaps it was due to my lack of experience with coding, but I found that part to be the most difficult to teach and engage students with.
- Note: we have updated the lesson since this feedback, and now there is an opportunity for students to create graphs in an easier-to-use format that requires less coding. See Biodiversity Interactive Coding Tutorial.
What changes would you make to future iterations? Why?
In order to make meaning from relatively complex topics like Biodiversity and Coding, the students need multiple points of access and scaffolding to be successful. Ideally, this topic would be chunked into multiple parts and assignments that unfold over several days and they need to be supported by me and the student teacher throughout this process.
I would provide other opportunities for data science in the classroom beyond just coding/ R. I personally am much more interested in using spatial data to analyze biological phenomena, specifically using mapping software such as ArcGIS.
I would have chosen a different dataset to manipulate and code with. I’m not entirely sure why, but the graphs we created with the BIOTIME dataset didn’t impress the students very much or generate much discussion. It sort of generated a collective shrug.
I am very interested in having my students generate their own data that could then be integrated and used in larger, real life datasets. Ideally, my students would have collected their own presence/absence data of ecological communities and then submitted that to be part of the BIOTIME effort that is already underway globally.
What do you believe are some of your students’ major takeaways from this lesson?
- That high level data analysis of large complex, biological datasets can be done more efficiently and quickly by writing and using code and computer programming. That BIOTIME database provides additional evidence that biodiversity is declining in many parts of the world.