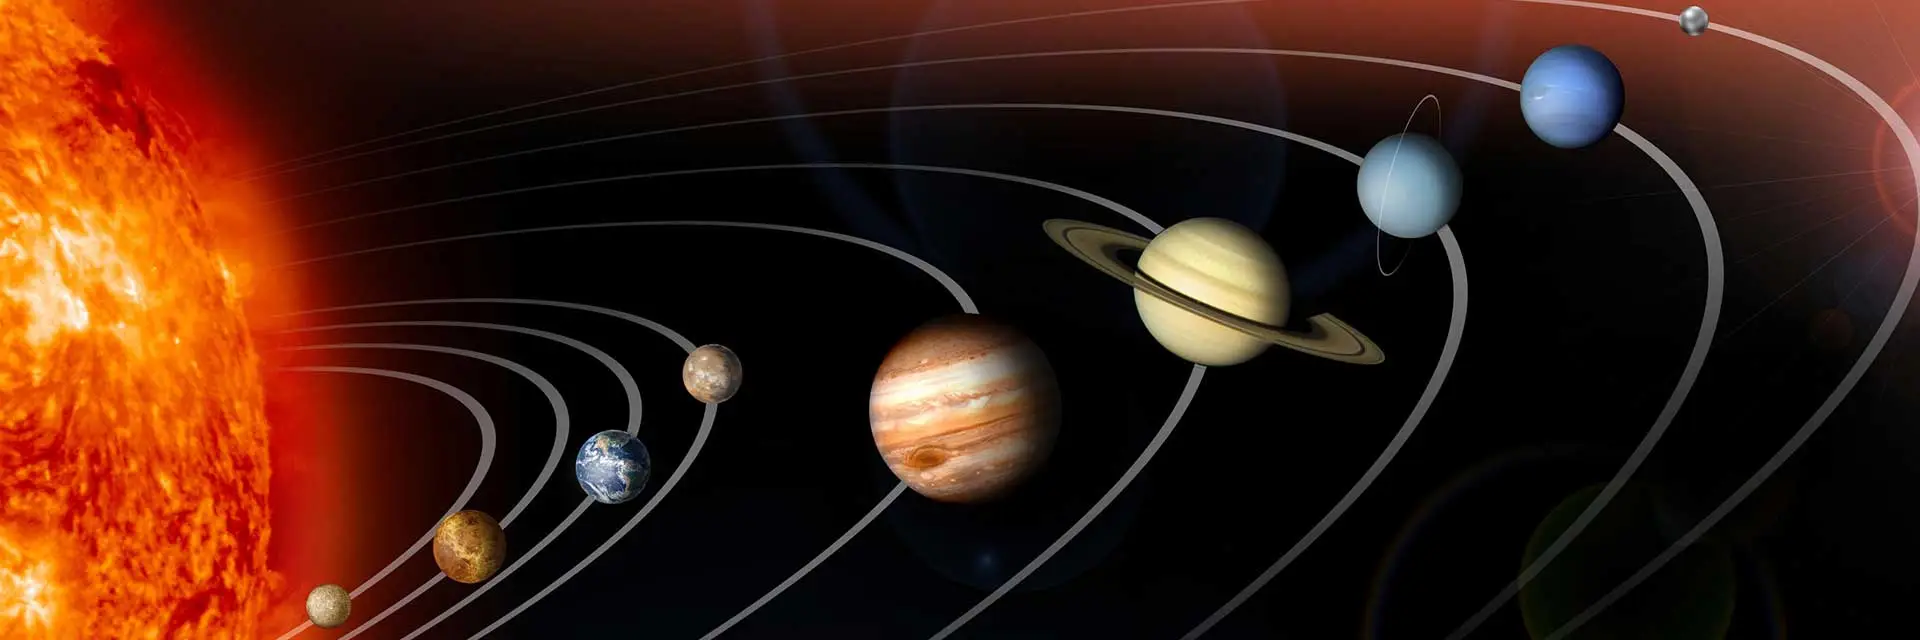
Lesson Overview: Analyzing Planetary Data with R
Grade Level & Class type
- Appropriate for: Middle to high school students
- Unit title: Astronomy Unit
- Number of students: 30 per class
- Time: 50 minutes

Lesson Plan and Materials
Data Science in the Lesson
Working with raw data set:
- Students collected and researched data sets for several reference points (distance from the sun, length of rotation and revolution, diameter, mass, etc) about 2 different planets or moons within our solar system.
Data visualization in lesson:
- Data visualization was present in several forms- Students had analyzed several different types of graphical displays of data that related to the data they were collecting. They also created scale model drawings to compare the diameters and distance from the sun for one inner planet or moon and one outer planet or moon
Interaction with computer coding:
- Students were presented with computer code during the undergraduate student presentation.
Lesson materials
Student-Facing Materials
- Classroom presentation: Data for beginning of class - google presentation or download Data for beginning of class - .pptx presentation
- Description: these were used as warm ups for class (this is still a work in progress)
- Data Science Presentation by Lewis & Clark undergraduate
- Description: A presentation give by an undergraduate student to introduce data science and coding to students.
- Comparing Surface Gravity to Mass over Surface Area of Planets - Worksheet
- Description: Students prove that the mass of the planet and its surface area determines the gravitational force of the planet
Teacher-Facing Materials
- Scope and Scale presentation: Classroom presentation Day 31-37 solar system exploration scale and structure
- Description: This is where the students researched and created their scale drawing models prior to the gravity vs. mass of planet lesson
- Example Part 2-Solar System Scale investigation including gravity extension
- Description: This is the example of the project the students created for the scale comparisons
- Optional: .zip file with R code used to make graphs for this lesson
Reflection from teachers who have done this lesson
What worked well? Why?
- The parts where the students were engaged in data manipulation. The students remembered this information all the way to the end of the year.
What do you believe are some of your students’ major takeaways from this lesson?
- Data is used to support and defend science thinking.
- Data is useful in helping us to determine how big or far away objects are in our universe.
- R could be really useful in large data sets