Salmon Crossing Data Tutorial

Fish Crossings - Introduction
Hello! Welcome to this tutorial. We’re going to learn about how a computer can use HUGE amounts of data and make cool graphs from it.
Today we’ll get to learn about fish crossings at dams in the Columbia River.
We’ll start by looking at the Bonneville Dam and learn how many salmon and steelhead cross the Bonneville dam each year.
What is the Bonneville Dam?


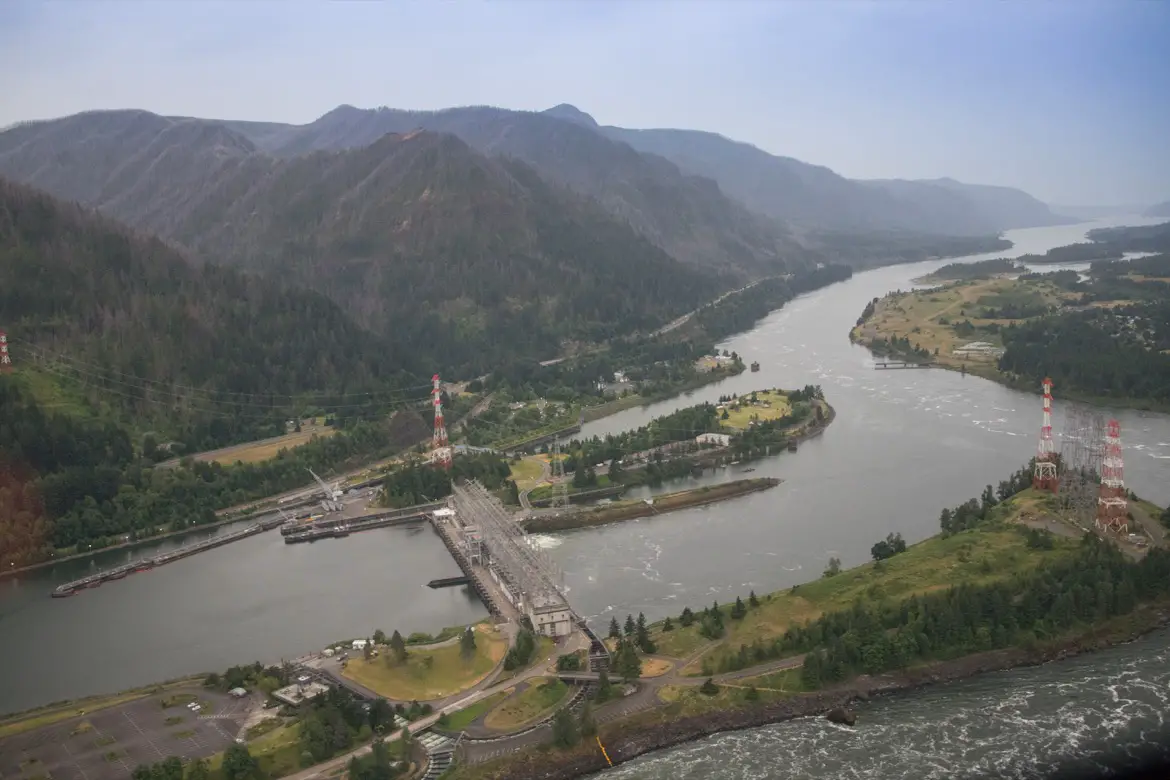
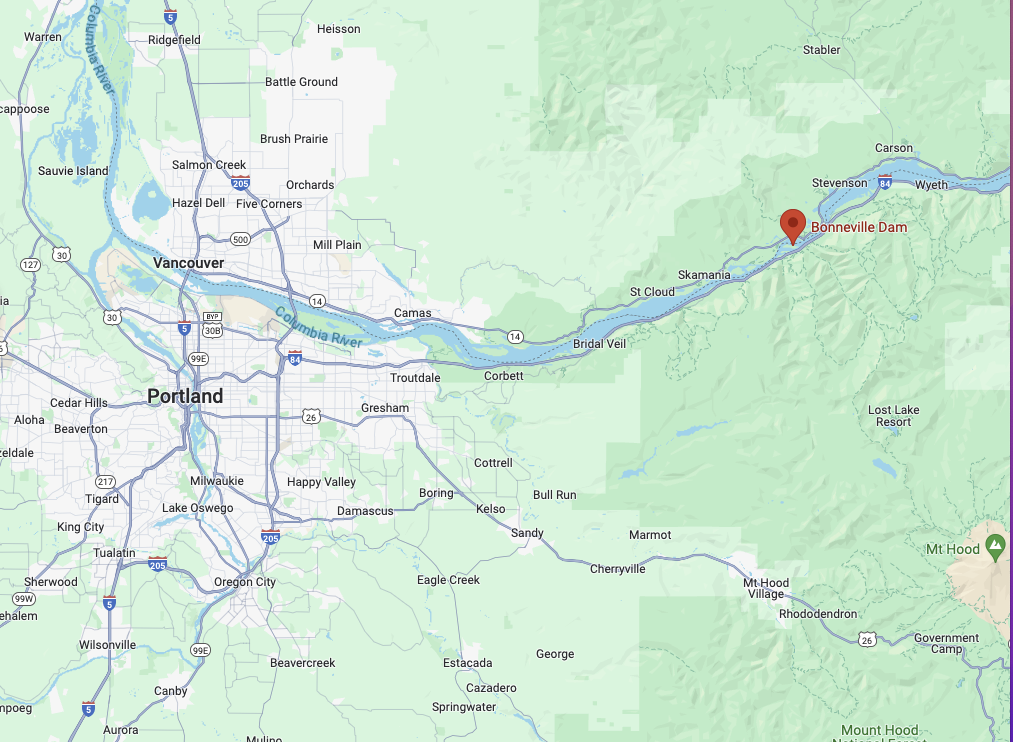
The Bonneville Dam is in the Columbia River and was constructed between 1933 and 1938. When it was constructed, it had a large impact on the surrounding land, Indigenous communities, and animals and plants.
Brainstorm:
What are some positive and negative impacts you think the dam might have?
Talk with your classmates about how some impacts the dam might have on the surronding areas. Here are some ideas you can consider:
- Hydropower
- Native American communities
- Salmon populations
- Salmon are important spiritually and culturally to Native Americans
- Sea lions
- Other animals who live where the dam was created
How does the Bonneville Dam impact Salmon?
In this tutorial, we’re going to look at data and learn about how the dam impacts Salmon returning to the Columbia river to spawn.
First, how are fishing swimming through the Bonneville Dam?
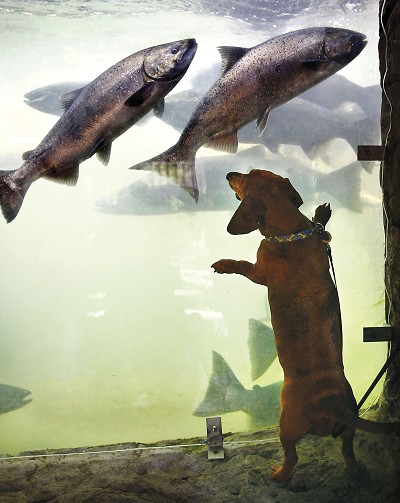
It is way to large for them to swim over, so they use a fish ladder to swim through the dam. Someone built the fish ladder when they were building the dam to help the fish get through! Watch this video to see how they can swim through the fish ladder.
As salmon come through the fish ladder, they need to be counted to see how many salmon come through and learn how many make it through the dam and return upstream to spawn. Some days, thousands of fish come through the dam! How do you think they are counted?
Watch this video to see!
As you saw in the video, someone counts each fish that goes by. They write down exactly how many fish they see, what time and what kind of fish. All those numbers get added together and become data. Then, someone puts all that data online for anyone to see (like us!).
There is A LOT of data (numbers of fish) that they collect. It would be pretty pretty hard to understand just by looking at it. In fact, if you click the blue box right below this, you can see all the data. It should look pretty confusing! Keep reading to learn how we can use the computer to better understand all those numbers.
Note: the data is from Columbia Basin Research
Analyzing HUGE data with the computer
We’re going to analyze all the numbers that are collected at the Bonneville Dam using the computer.
Using R
We will use a coding language called “R”. Basically, “R” is a collection of commands that the computer understands. You can tell the computer one of the commands and it will know to do something.
For example one command the computer knows is multiplication! Try typing 5*3 in the box right below this. Then click the green play button that says “run code”
Press run code
What happened? Did you see the number 15 pop out?
The computer can also do very complicated things, like create graphs. We’ll learn more about that later in this tutorial.
The box above where you typed 5*3 is called a code chunk. You can type commands into any similar box and it will tell the computer to do various things.
Here’s another code chunk you can try typing something into. Maybe you want to try a division problem? Or maybe you want the computer to say hello to you? There’s a few different tabs you can click on to learn how to do cool things!
Want to try out your own code? Maybe another math problem? Here’s a place to do that. Otherwise click on the tabs to learn something new!
Would you like the computer to say hello to you?
First, type your name where the blank _______ is, in the second code chunk. Don’t delete the quotation marks.
Here’s an example:
Now your turn. Type your name instead of the blank _____ and then click play:
We can use r to find the largest number in a long list of numbers. To try this out, type a bunch of numbers inside the parentheses (______). Separate your numbers with a comma. Don’t delete anything else!
Here’s an example:
Now you try. Type your numbers after the first parenthesis and separate them with a comma. Then click run.
Now let’s run a function that will tell us which number is the biggest. Click the play button on this code chunk too.
Looking at data
One thing the computer is very useful for is dealing with HUGE amounts of data. Data is a collection of lots of numbers that tell us information about something.
Let’s return to the data that is collected at the Bonneville Dam. I’ve used coding in the background of this tutorial to make it a little more condensed than the data you saw before. Want to look at it? Click the blue box below.
Wow that’s a lot of numbers! This is a HUGE amount of data. Notice how you can scroll on the data and there are 9 separate pages which show new entries.
How to read the data table
Let’s learn about what some of this data means. First, the table that you see when you click the blue rectangle above is called a data table. It contains a bunch of numbers which tell us how many fish crossed the Bonneville Dam on any given day.
Reading Dates
On the top of the data table, you’ll see bolded numbers like 1/1, 1/2, etc. Do you have a guess what those might mean? Discuss with your neighbor and then click the tab above to see the answer.

Those numbers are referring to dates! For example, 1/1 is January 1. But, they don’t include the year. Can you spot where the year is in the data?
Can you find how many fish crossed the Bonneville Dam on April 1 in 2022?
✗0
✓57
✗30495
On the far left side of the data, you should see the year. Find 2022 and then find 4/1 on the top. What number is underneath 4/1 in the 2022 row?
Finding the maximum fish crossings in a year
What is the maximum number of fish that crossed the Bonneville Dam in one day in 2021?
See if you can find the biggest number in the 2021 row. If it seems too hard, scroll down past this question to learn an easy way to do this with the computer!
Were you able to figure out the maximum number of fish that crossed the Bonneville Dam in one day in 2021? It was probably pretty annoying to have to look through all the numbers…
Luckily, the computer can make this task much easier! Try running the code below. It will find the maximum number in 2021. If you want to learn more about how it works, click the “Learn more” tab.
Press the green play button.
Do you see the number 18848 pop out after you run the code? That’s the largest number of fish that crossed the Bonneville dam in 2021 in a day!
Here’s the code we’re using again:
Do you recognize any words in the code?
max: This is called a “function”. It tells the computer to find the max value.
Bonneville_chinook: This tells the computer to look in our data called
Bonneville_chinook2: This tells the computer to look specifically at the second row of the the data, which is the 2021 row.
Want to try using the code yourself? See if you can figure out how to find the maximum value in 2019. Edit the code in the code editor below:
Hint: The “2” tells the computer which row to look at. How many rows down is 2019?
So the largest number of fish that crossed the Bonneville dam in 2021 in a day is 18848!
Finding the total number of fish that cross the Bonneville dam each year
What if you wanted to know how many total fish crossed the dam this year, compared to 50 years ago? We can use the computer to answer that question too!
Brainstorm
First, let’s make a prediction. Think about what you’ve learned about dams and how they impact fish trying to get past them.
Do you think there are more fish or less fish in 2022 compared to 1972 (50 years before)? Talk to your neighbor about your predictions!
When you’re ready to check your answer, run the code below. It will find the sum of the rows with 2022 data and 1972 data.
Graphing
Another way we can look at this data is by graphing it. The computer can help us a lot with this too.
We’re going to make a graph of the total number of Chinook that cross the Bonneville each year.
Below this, we have code to create graphs of all the data we were looking at before. Press the green run code button to see the graph. There are options to look at a graph with and without a connecting line between the points.
Press run code
Press run code
Want to try changing the color of the line and the points?
In the code chunk below, replace the red lines ____ with the color you want for the connecting line and the points. Make sure to write your color inside the quotes "". Here’s an example: pointColor = "red"
Here are some color options you can try:
-   "red"
-   "green"
-   "purple"
-   "salmon"
-   "darkblue"
-   "orange"
Type in your colors below and then press run code.
Now that you’ve chosen the colors, you can run the graph code again. Press run code right below this text.
Brainstorm
- What do you see?
- What does it mean?
- What do you wonder?
Note to teachers At this point I recommend you check out THIS PRESENTATION to explore what the graphs mean in your class. Additionally, click to the end of this tutorial to see other graphs for different locations and species.
Congratulations!!
You learned how you can use the computer to look at large amounts of numbers and data. But, data doesn’t tell us everything!
Brainstorm
What questions do you have after looking at this data?
How could you find the answer to those questions?
Are there other ways you could learn about the impact of the dam other than looking at data?
How would you do that?
Possible methods: interviews, online research, looking at pictures of the dam and surronding areas, visiting the dam, learning about salmon biology
What do the data/numbers not tell us?
Want to learn more?
This is the end of the tutorial but there’s lots more resources to explore!
Click the “More Graphs!” button to see more graphs of Steelhead and Chinook species at the Bonneville and Dalles dams. Feel free to use these in your classroom.
Additionally check out the linked lesson plans for more resources to teach about salmon and the Bonneville Dam.

Graphs of other species and locations
Here are graphs of other species (Chinook and Steelhead) at other dams (Dalles and Bonneville) as well which you can take a look at!
Press run code on each of the code chunks below to see different graphs.
Chinook Crossings at the Dalles
Steelhead Crossings at the Bonneville Dam
The End!
