Box Plots
1 What is a box plot
A box plot is a graph that shows a numeric summary (y-axis) of either a categorical or numerical variable (x-axis). It gives information on the spread of data.
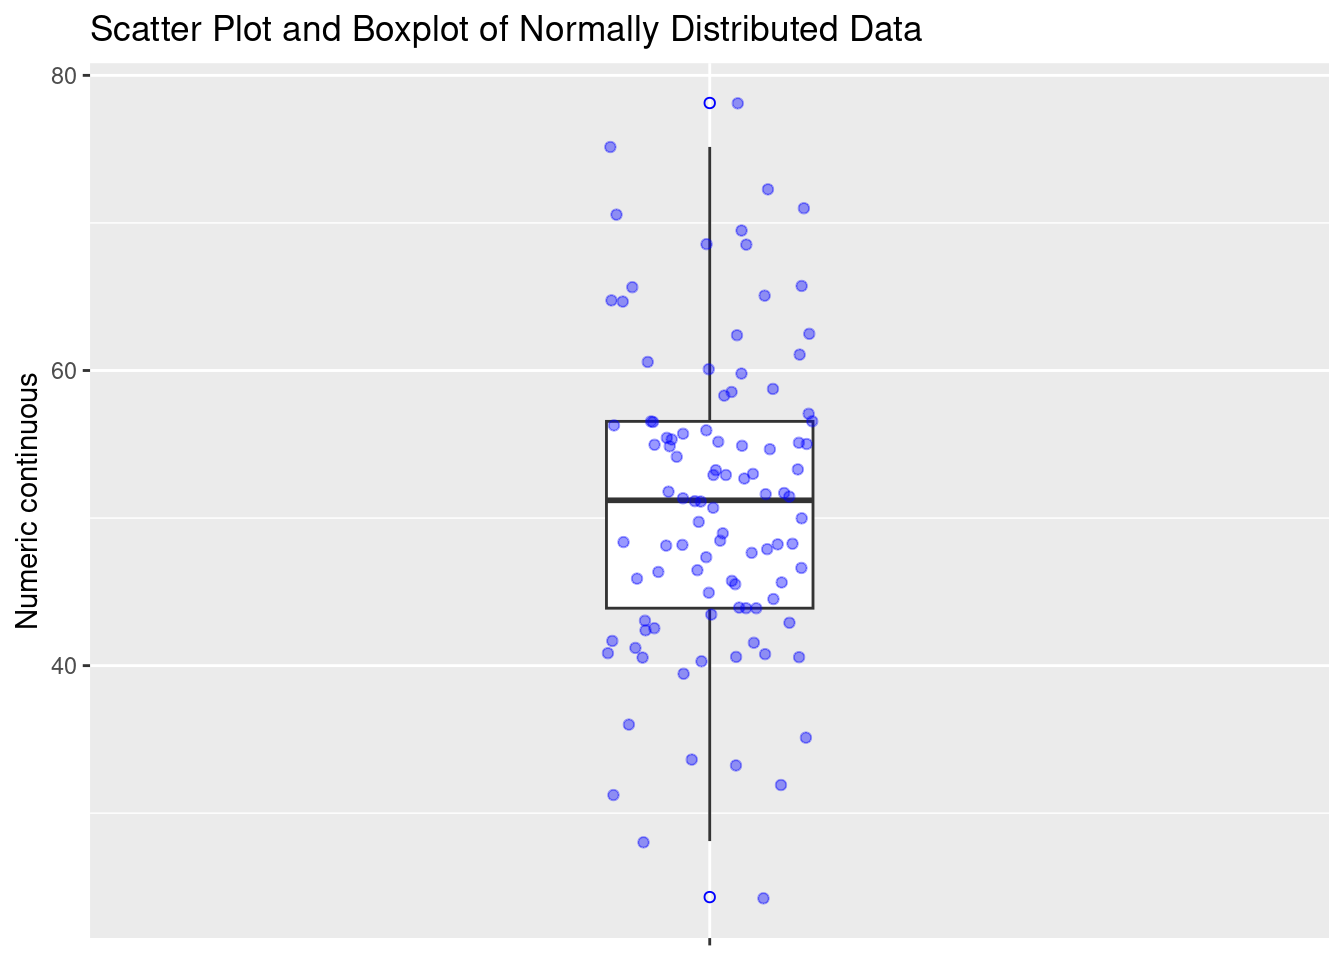
Here is the framework of a box plot, with a normally distributed data set.
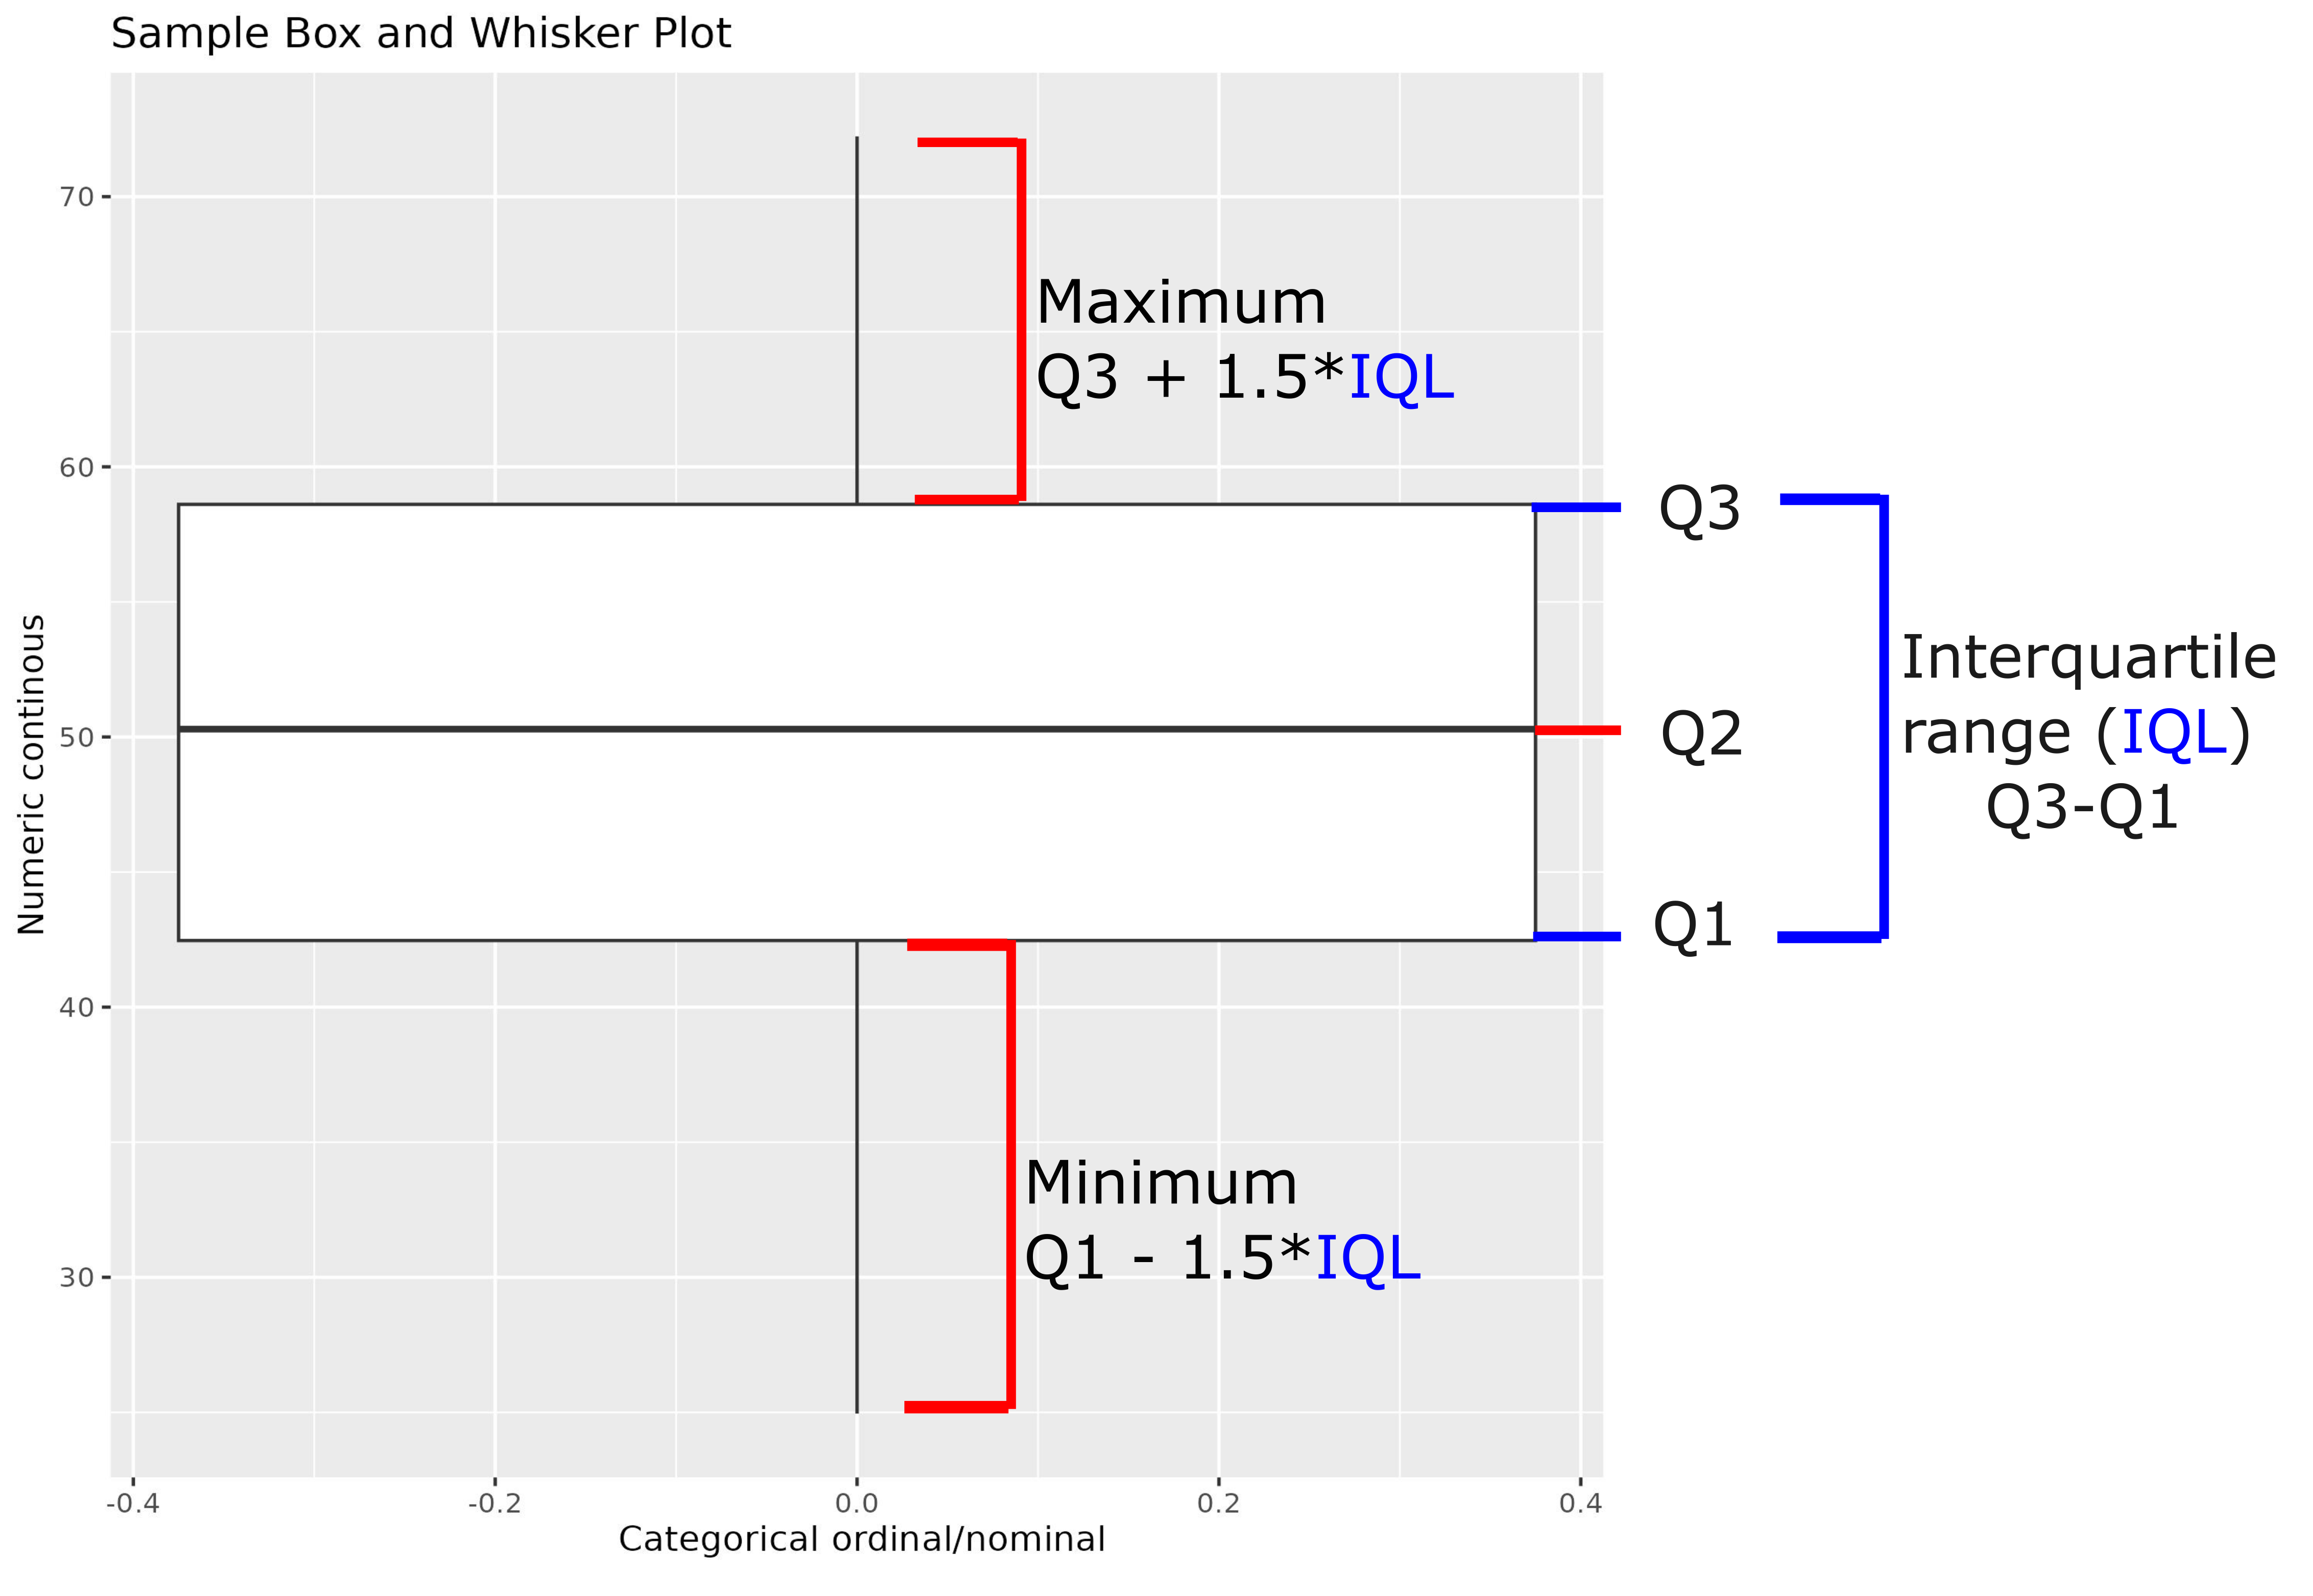
The “box,” as shown below, represents three values: the 25th percentile (Q1), median (Q2), and the 75th percentile (Q3). Each horizontal bar corresponds to a number where that percentage of the data falls below, as shown. The box contains 50% of the data, known as the interquartile range. This value is calculated by subtracting Q1 from Q3.
The vertical lines that emerge from the box are called whiskers. The whisker closest to the x-axis represents the minimum calculated by subtracting 1.5 times the interquartile range from the value for Q1. The furthest whisker from the x-axis represents the maximum calculated by subtracting 1.5 times the interquartile range from Q3.
Here is the same data plotted as a scatter plot and a box plot. “Index” refers to the position on the list from which the random numbers were generated. In short, a boxplot gives a summary as to where your data lie, or how the data is spread.
2 Penguin Data
Using the penguin dataset, we can compare the flipper lengths (variable: flipper_length_mm) of the different species (variable: species) of penguins.
Note: We will call on the geom_boxplot( ) function when we code using ggplot
ggplot(data=penguins, mapping = aes(x=species, y=flipper_length_mm))+
  geom_boxplot()+
  labs(x="Species of Antarctic penguin", y="Flipper length (mm)", title = "Species of Antarctic penguins have different flipper lengths")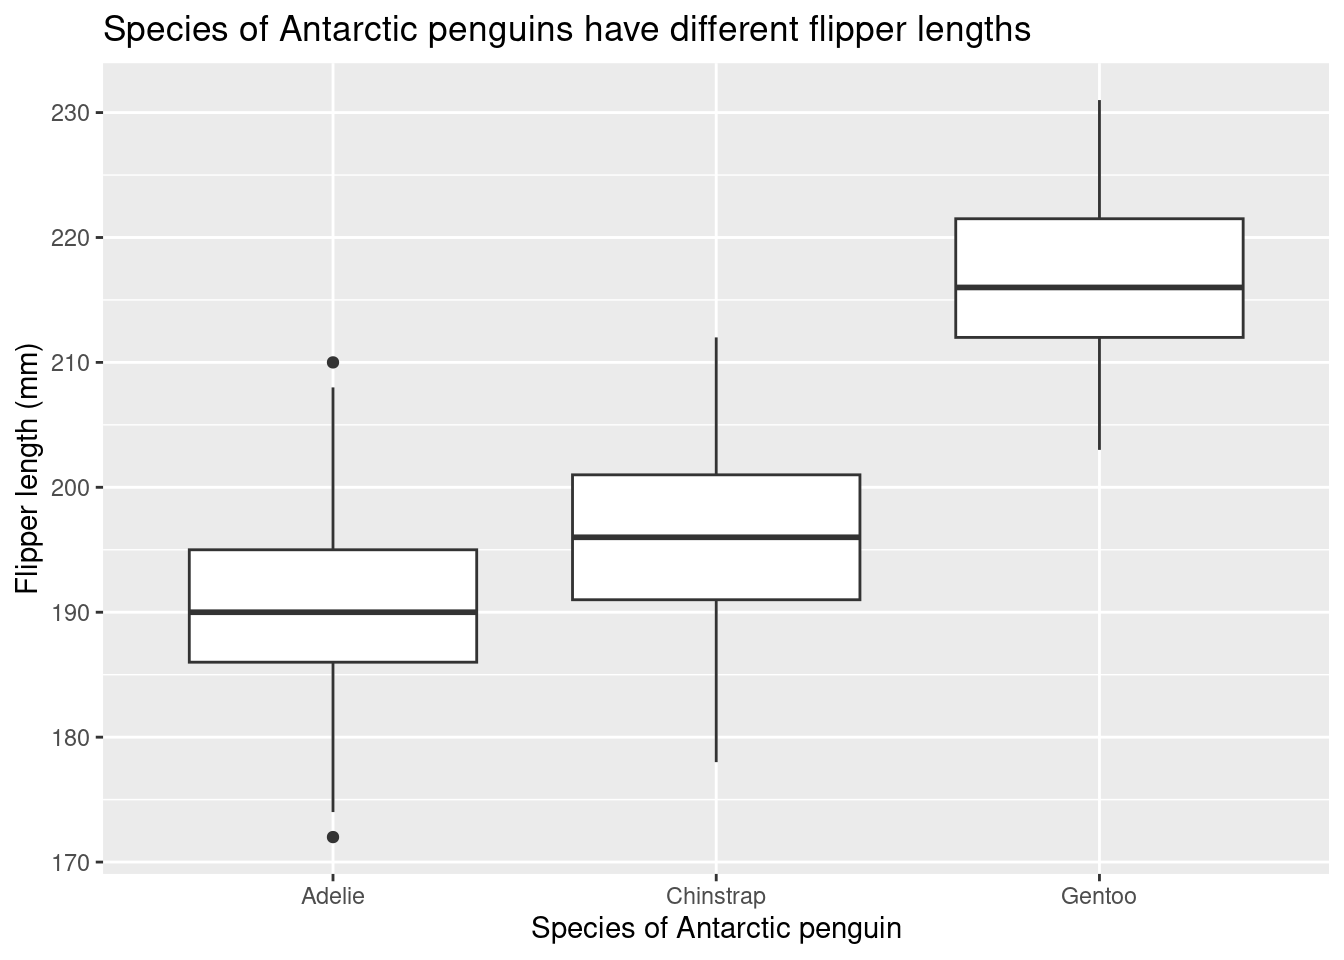
For the Adelie penguins, there are outliers on either side of the whiskers. These are values fall short/exceed the whisker value calculation.
This boxplot shows us that Gentoo penguins generally have a larger flipper length in millimeters than Chinstrap and Adelie penguins.
Now, compare the flipper lengths (variable: flipper_length_mm) of the different sexes (variable: sex) of penguins. Don’t worry about adding a title or axes labels!
R is case sensitive! The data set is named “penguins” and the variables are “body_mass_g” and “sex”. Which variable is categorical (x-variable) and which variable is numerical (y-variable)?
ggplot(data=penguins, mapping = aes(x=sex, y=body_mass_g))+
  geom_boxplot()
Which sex from the penguins data set tend to have a larger body mass in grams?
3 Chick Data
Using the ChickWeight data, show the spread of the weight (variable: “weight”) of the chicks on different diets (variable: “Diet”).
Make sure you have the correct x and y-variables! The x-variable is a categorical variable, and the y-variable is a numerical variable.
ggplot(data=ChickWeight, mapping = aes(x=Diet, y=weight))+
  geom_boxplot()
This chick data shows that there is not much of a difference in the spread of data across the four chick diets.