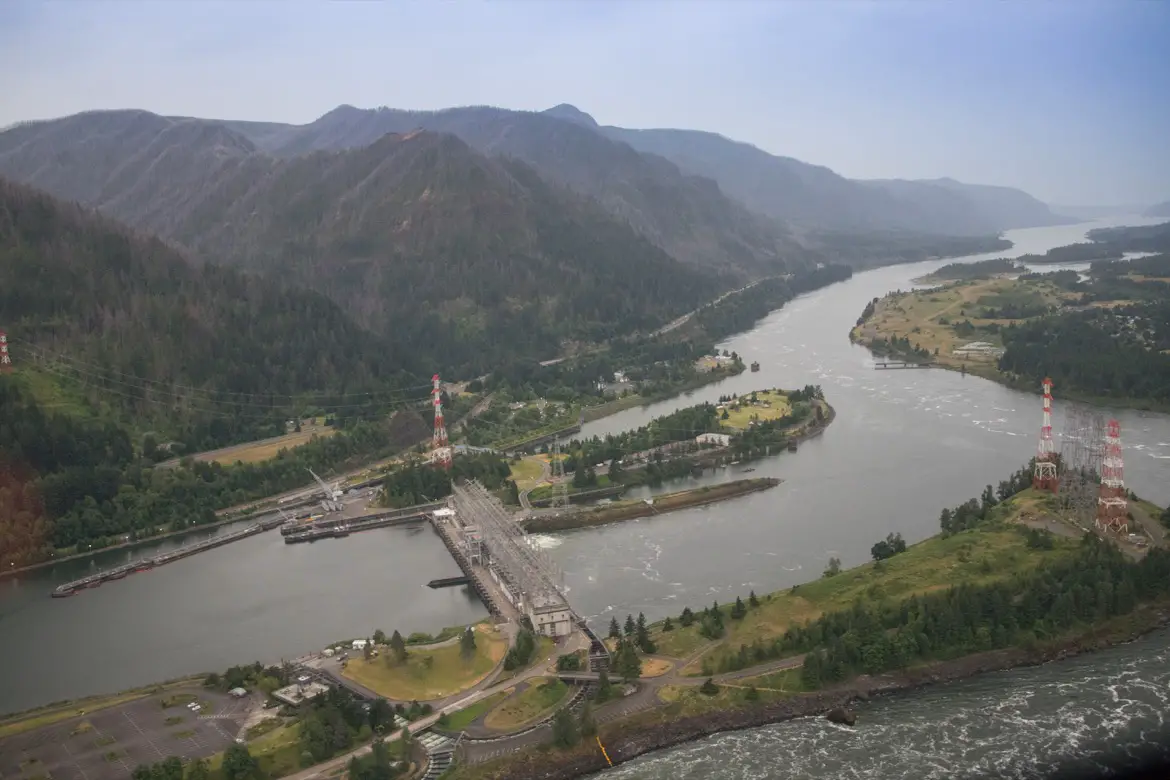
Lesson Plan - Analyzing and Interpreting Salmon Return at Bonneville Dam
Grade Level & Class type
- Appropriate for: 6th-8th grade
- Unit title: Ecology Unit
- Number of students: 20-25 per class
- Time: Three 45 minute lessons
Lesson Plan and Slides

Central Focus/Big idea:
- Analyze and interpret data about Chinook salmon return at Bonneville and Dalles dams to describe and explain changes in Chinook salmon population over time.
Content Standards:
- NGSS Science and Engineering: Practice 4 Analyzing and Interpreting Data
- Opportunities to extend this lesson to a broader unit that covers other contents standards like:
- MS-ESS3-3. Apply scientific principles to design a method for monitoring and minimizing a human impact on the environment (classroom 2)
- MS-LS2-1. Analyze and interpret data to provide evidence for the effects of resource availability on organisms and populations of organisms in an ecosystem.
- MS-LS2-4. Construct an argument supported by empirical evidence that changes to physical or biological components of an ecosystem affect populations.
Learning Objectives:
- Students will practice analyzing and interpreting data and complete a pre assessment.
- Students will understand how a larger data set was compiled into a data visualization.
- Students will analyze patterns in salmon return rates.
- Students will interpret patterns applying their research/background knowledge.
- Students will complete an assessment to show proficiency in analyzing and interpreting data.
Extension:
- Students will research the salmon life cycle and impacts on salmon populations.
- Students will learn about dams and their role in salmon population changes.
- Students will apply data analysis and interpretation skills to analyzing global temperature patterns and drought patterns in the West.
Assessment: (What evidence of learning will you collect at the end of the lesson? How will you know what students have learned?)
- Pre Assessment: Data Analysis and Interpretation
- Final Assessment: Data Analysis and Interpretation: Salmon population patterns. Checklist and grading rubric included.
Detailed Lesson Sequence
| Part | Duration | Summary | Slides | Materials |
| 1 | 5 min | WARM UP Get ready for the day and analyze a graph from New York TImes, What’s Going on In this Graph: Egg Prices |
1-2 | Slides |
| 2 | 10 min | WHY SHOULD WE KNOW HOW TO MAKE SENSE OF DATA Students work in partners to brainstorm reasons to be able to read graphs and data and come together for a whole group share out |
3 | Chart paper and/or sticky notes |
| 3 | 15 - 20 min | INDEPENDENT PRE-ASSESSMENT Students work independently on a pre-assessment to interpret changes in a two variable data visualization |
4-5 | Pre-assessment |
| 4 | 10 min | REVIEW PRE-ASSESSMENT Go over the pre-assessment with students, solicit correct answers from students and correct where needed |
N/A |
End of day 1
| Part | Duration | Summary | Slides | Materials |
| 5 | 3 min | INTRO TO CODING Introduce the idea that computers take specific commands to generate something great! Data visualizations or graphs, in our case. |
6-7 | |
| 6 | 8 min | CODING ACTIVITY: STUDENTS AS COMPUTERS Students will do a quick activity where they channel their inner programmer and give their classmates code/commands to move to a different spot in the room. |
8 | Handout: Coding Worksheet |
| 7 | 10 min | USING CODE TO MAKE DATA VISUALIZATIONS Watch the video or demo how computer tools, like R, can help us to take really large data sets more easily to analyze by creating a data visualization. |
9 | Video of how to code OR Interactive tutorial to model using code to create graphs |
| 8 | 10 min | ESTABLISH BACKGROUND INFO ABOUT THE DATA Provide students with some background info about where the data they are about to look at comes from |
10-13 | Bonneville Dam Fish Ladder September |
| 9 | 10 min | INTRODUCTION TO THE GRAPHS Students are introduced to two graphs they will analyze on their assessment and are asked to begin interpreting changes. Student begin by just looking at the axis titles |
14-16 | WIS/WIM Graphs for Notebooks |
| 10 | 5 min | EXIT TICKET @ WHITEBOARDS Students work in a small group to complete two short reflections questions |
17 |
End of day 2
| Part | Duration | Summary | Slides | Materials |
| 11 | 40 min | WORK TIME FOR ASSESSMENT Students are given time to work on their assessment to assess the standard to analyze and interpret data. |
18-19 | Assessment: Data Analysis and Interpretation: Salmon population patterns |
End of day 3
Adaptations/Modifications:
| Emergent Bilingual | The assessment could be given in different languages, sentence stems are provided for longer response |
| TAG | Extension activities provided |
| Special Needs | Sentence stems are provided |
Supplemental Lesson Resources:
Consider using these resources to support variations in teaching this lesson.
Biodiversity and Environmental Impacts, Created by Emily Bosanquet
Global Temperature Patterns and Data Analysis Assessment (NASA data), Created by Emily Bosanquet
Drought and Its Impacts and Data Analysis Assessment (US Drought Monitor data), Created by Emily Bosanquet
Pre lesson on salmon life cycle and impacts to salmon population: Salmon Life Cycle and Impacts, Created by Emily Bosanquet
Impacts of dams on our community resource folder, created by Jenna Mobley